1.主机直接部署ganglia监控 2.通过rancher部署ganglia监控
主机部署
Ganglia的安装与部署(单播 ps:要使用多播查看相关链接)
- 安装httpd服务与php
sudo yum -y install httpd php
- 安装其他依赖
sudo yum -y install rrdtool perl-rrdtool rrdtool-devel
sudo yum -y install apr-devel - 安装ganglia
sudo yum -y install epel-release
sudo yum -y install ganglia-gmetad
sudo yum -y install ganglia-web
sudo yum install -y ganglia-gmond - 修改配置文件ganglia.conf
sudo vim /etc/httpd/conf.d/ganglia.conf
    Alias /ganglia /usr/share/ganglia
    <Location /ganglia>
      Require all granted
      # Require local
      # Require ip 10.1.2.3
      # Require host example.org
    </Location>
- 修改配置文件gmetad.conf
sudo vim /etc/ganglia/gmetad.conf
data_source “test” ip - 修改配置文件gmond.conf
sudo vim /etc/ganglia/gmond.conf
修改为,主机名和ip与上面配置一致
    cluster {
      name = "hadoop-101"
      owner = "unspecified"
      latlong = "unspecified"
      url = "unspecified"
    }
    udp_send_channel {
      #bind_hostname = yes # Highly recommended, soon to be default.
                           # This option tells gmond to use a source address
                           # that resolves to the machine's hostname.  Without
                           # this, the metrics may appear to come from any
                           # interface and the DNS names associated with
                           # those IPs will be used to create the RRDs.
      # mcast_join = 239.2.11.71
      host = 192.168.114.101
      port = 8649
      ttl = 1
    }
    udp_recv_channel {
      # mcast_join = 239.2.11.71
      port = 8649
      # bind = ip
      retry_bind = true
    }
- 修改配置文件config
sudo vim /etc/selinux/config
修改为 SELINUX=disabled
注意,selinux本次生效关闭必须重启,如果此时不想重启,可以执行下面命令临时生效
sudo setenforce 0 - 启动ganglia
sudo service httpd start
sudo service gmetad start
sudo service gmond start - 打开网页浏览ganglia页面
ip/ganglia
注意,如果完成以上操作依然出现权限不足错误,请修改/var/lib/ganglia目录的权限,执行下面命令
sudo chmod -R 777 /var/lib/ganglia
rancher部署
- 搜索ganglia容器
docker search ganglia
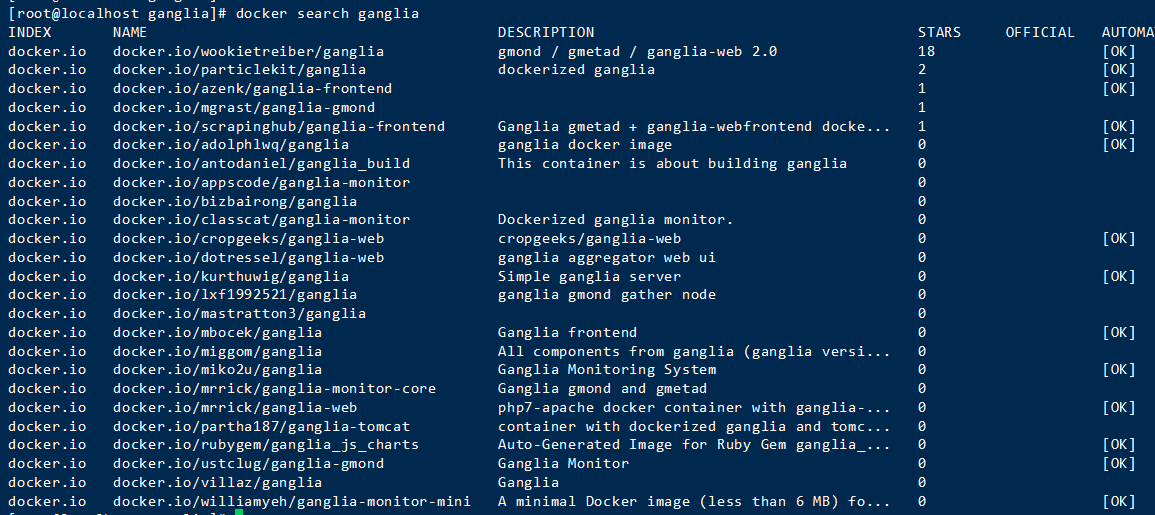
- 拉去第一个镜像进行安装部署
docker pull docker.io/wookietreiber/ganglia
- 通过rancher运行镜像(配置网络–主机),进入容器中修改配置文件
vi /etc/ganglia/gmetad.conf
vi /etc/ganglia/gmond.conf
修改内容和上面的一直,ip使用容器挂载的主机的ip - 重启容器,访问ip/ganglia即可查看
flume添加ganglia监控
- 启动flume任务
bin/flume-ng agent –conf conf -z
“10.19.154.7:2181,10.19.37.131:2181,10.19.46.52:2181” -p “/flume_spooldir_test” –name “a1”
-Dflume.root.logger=DEBUG,console
-Dlog4j.configurationFile=conf/log4j2.xml
-Dflume.monitoring.type=ganglia
-Dflume.monitoring.hosts=ip:8649 - flume参数
| 字段(图标名称) | 字段含义 |
|---|---|
| ChannelCapacity | channel的容量 |
| ChannelFillPercentage | channel占用百分比 |
| ChannelSize | 目前channel中事件的总数量 |
| EventPutAttemptCount | source尝试写入channel的事件总数量 |
| EventPutSuccessCount | 成功写入channel且提交的事件总数量 |
| EventTakeAttemptCount | sink尝试从channel拉取事件的总数量。这不意味着每次事件都被返回,因为sink拉取的时候channel可能没有任何数据 |
| EventTakeSuccessCount | sink成功读取的事件的总数量 |
| StartTime | channel启动的时间(毫秒) |
| StopTime | channel停止的时间(毫秒) |
参考链接
ganglia github
Hadoop生态圈-使用Ganglia监控flume中间件
Flume监控之Ganglia